
Bill Ackman covers short
In the trillion dollar U.S. Treasuries market Bill Ackman exits his billion dollar bond short position right at the bottom. A perfect trade.
It's Treasury futures market weekend for me. I'm finally looking at my ghost patterns in the CME Group's U.S. Treasuries Futures and I'm finding all kinds of very interesting stuff. The celebrity fund managers like to tweet their trades because they know their tweets are worth millions in profits when their followers jump into the same trade. So, the strategy is tweet it the moment you've completed the trade. Here's Bill Ackman's tweet:
We covered our bond short.
— Bill Ackman (@BillAckman) October 23, 2023
👻Ghost Pattern on 10-Year Treasury Futures:
Each green bands on the image below is my ghost pattern identifying extreme buying.
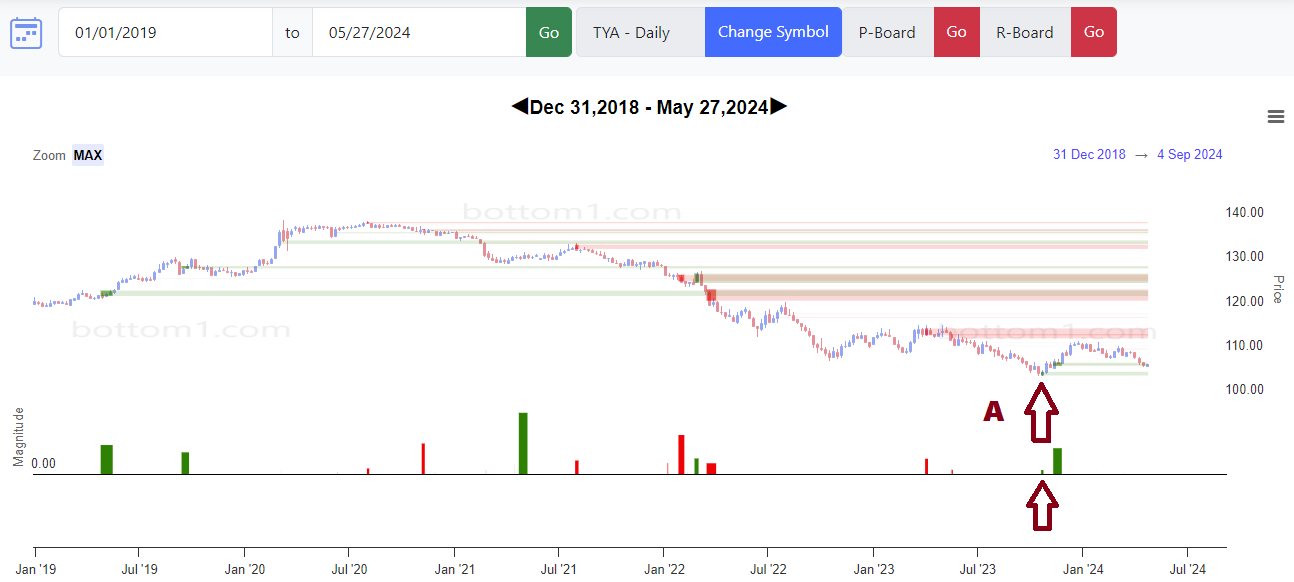
A: Ackman exits his short position
👻Ghost pattern identifies 3 trading days of non-stop buying October 19 - October 23, 2019. The day he finished buying he tweeted his move! I wanted to show the whole chart so I could demonstrate the timing of his trade. Right at the bottom of a 3 year move. Wow! Hell of a trade Mr. Ackman.
An inquisitive reader might wonder what is that big green bar just to the right of the Ackman trade? That's insiders cheaters getting in before the Fed announces their tightening cycle is over. That trade goes from November 9th - 24 2023; 12 days of non-stop buying. Just 2.5 weeks later on December 13, 2023 the Fed informs the public their tightening cycle is likely over:
Notice how the magnitude of that bar dwarfs Ackman's trade. But geez Ackman was in even before the insiders cheaters got the word making big profits. 🐐
One more thing. An inquisitive reader might also look at the current price (as of this writing) of the chart and see that we are right back where the Fed pivoted. Well that's a bit strange isn't it? So, on this chart if the price goes up interest rates go down. If the price goes down, interest rates go up. So, either we're about to see a stock market pull back that's going to steam roll the BTFD / YOLO crowd, run stops and then recover. OR this chart has to reverse and the price has to go up again to align with monetary policy which is according to the Fed supposed to be looser. Me? I'm waiting for more ghost patterns in stocks, futures or treasuries 😉 👇