
Ghost Pattern proves COVID-19 Foreknowledge

Using my ghost pattern, I can prove through a timeline of events that there was foreknowledge of Covid-19. Hundreds of billions of dollars were made by American Oligarchs during the trade of the century!
Every step of the way, the oligarchs 👑 of America and their inner circles knew what was coming and when. If I hadn't discovered this ghost pattern in the stock and futures markets, which identifies large swaths of extreme buying and selling, I wouldn't have been able to put this timeline together. Without the ghost pattern preceding every major event, this would all be one giant, tin foil hat wearing conspiracy theory! No one else on the entire Internet can show you what I'm showing you because no one else has this ghost pattern. While everyone else is focusing on proving the "lab leak" Covid-19 origin theory fact, I'm showing you what the MONEY knew and when!
Before we get into it, I understand this idea of a ghost pattern might be foreign to most everyone. However, it's a real phenomenon in the stock market. It's basically anomalies in the market data feeds. This is what I've found, an anomaly in the data. After I invented a completely new stock market indicator to help in my trading, I found the ghost pattern buried deep within it. To prove my point further that "ghost patterns" in the stock market exist, here's a quote from D.E. Shaw, who famously discovered a ghost pattern back in the 1980's. Yes, the same D.E. Shaw who currently manages $60Billion in assets and who Jeff Bezos worked for before he founded Amazon 😲. Shaw said: "patterns [in the stock market] that are difficult or impossible to explain are more valuable because others are less likely to discover or exploit them."
The timeline of events and graph below is my attempt to help you see and understand what I've uncovered. After discovering this ghost pattern, I wrote a serious of articles I call the #SmokingGun series. My findings are nothing short of astonishing. I have to be honest, after making these discoveries in the SmokingGun series, I desperately wanted to find the "smoking gun" for Covid-19, the holy grail of modern day cover-ups. I didn't think I would succeed because of so much content related to Covid. However, when I dug deep into the Federal Reserve's actions in 2019, their shenanigans made everything line up. With a combination of the timing of the ghost pattern dates on Boeing, ExxonMobil and 10yr-Treasuries, and the timing of the Federal Reserve's actions along with the resulting market moves, there's almost no doubt there was foreknowledge. The trades are just too perfect. You always hear the phrase "follow the money". I say: "follow the money on the stock market!"
In the words of Takeshi's Castle. Let's geet eeet on!
Timeline of events
- March 18, 2019: Extreme selling of ExxonMobil stock begins under the guise of a bad earnings quarter. Selling detected by my ghost pattern 👻.
- March 19-20, 2019: The Federal Reserve releases meeting minutes to the public stating that a few Federal Reserve Governors were concerned about financial stability risks. Source.
- April 24, 2019: 10-yr treasury futures panic buying begins identified by another ghost pattern. Almost to the day as ExxonMobil stock finishes selling off 👻.
- April 26, 2019: Extreme selling of ExxonMobil stock finishes marking 36 days of non-stop selling 👻.
- May 6, 2019: New York Federal Reserve Bank conducts large test exercises in the REPO market. Source.
- May 15, 2019: Panic buying of 10yr treasure futures ends marking 16 days of non-stop buying 👻.
- July 31, 2019: Secretly and without notifying the public, The Federal Reserve's FOMC authorizes a directive for the Open Market Trading Desk at the Federal Reserve Bank of New York to conduct overnight repurchase agreement (repo) operations sometime in the future. This secret directive also triggered a tiny ghost pattern which means
insiderscheaters were front-running the Federal Reserve's trading desk at the Federal Reserve Bank of New York and made 10's of millions on that trade! Damn. - September 10, 2019: First wave of Boeing panic selling starts 👻.
- September 12, 2019: Panic buying of 10yr-Treasuries begins 👻.
- September 16, 2019: Overnight Repo Lending Rates, which are usually at 2%, surged to an alarming 10%! Source.
- September 17, 2019: Banking Crisis begins! The New York Federal Reserve Bank announces to the public it will perform $75 billion in repo operations using it's authority given to them by the secret July 31, 2019 directive. Curiously, the test operations done on May 6, 2019 were done in the amount of $75 million. Literally the exact amount less 1 zero at the end. What a coincidence! Source.
- September 17, 2019: The Federal Reserve Bank of New York finally tells the public about the secret authorization done 45 days earlier on July 31, 2019. Source. Federal Reserve / Banking watchdog Wallstreetonparade.com was the first to break this story! Support them. They rock!
- September 25, 2019: Panic buying of 10yr-Treasuries ends marking 10 days of non-stop buying 👻.
- October 11, 2019: First wave of Boeing panic selling ends marking 24 days of non-stop selling 👻.
- November 2019: US Intelligence officials warn the Trump Administration that corona virus spreading in China could be a "cataclysmic event". Source.
- December 23, 2019: Ghost pattern detects a second wave of panic selling in Boeing stock 👻.
- January 23, 2020 - January 27, 2020: Ghost pattern detects only 3 days of panic selling in ExxonMobil stock. Wait. What? Why no panic selling like Boeing!? Because the panic selling already happened back in March 2019 and ExxonMobil stock has already lost -20% of its value at this point. This short ghost pattern is probably the result of PUT options hitting the market. Meaning ExxonMobil stock is now being shorted in anticipation of the upcoming market crash! 👻
- January 24, 2020: Panic selling in Boeing stock ends marking 25 days of non-stop selling. 👻
- February 20, 2020: U.S stock markets crash. Source.
- ExxonMobil stock loses -89% of its value from March 2019 when the selling started.
- Boeing loses -125% of its value from September 2019 when the selling started.
- March 18, 2020 - June 2, 2020: Boeing is panic bought for 3 months straight. Right at the bottom of the stock market crash. What a trade! 👻
- October 9, 2020 - November 6, 2020: ExxonMobil stock is panic bought for 21 straight days revealing a massive technical trading event. 👻
- +346% return on ExxonMobil stock: Reply to this post on Twitter if you can ever recall a time in your life when you had an opportunity to make 346% return on ExxonMobil. Only an oligarch level
insidercheater could do this!
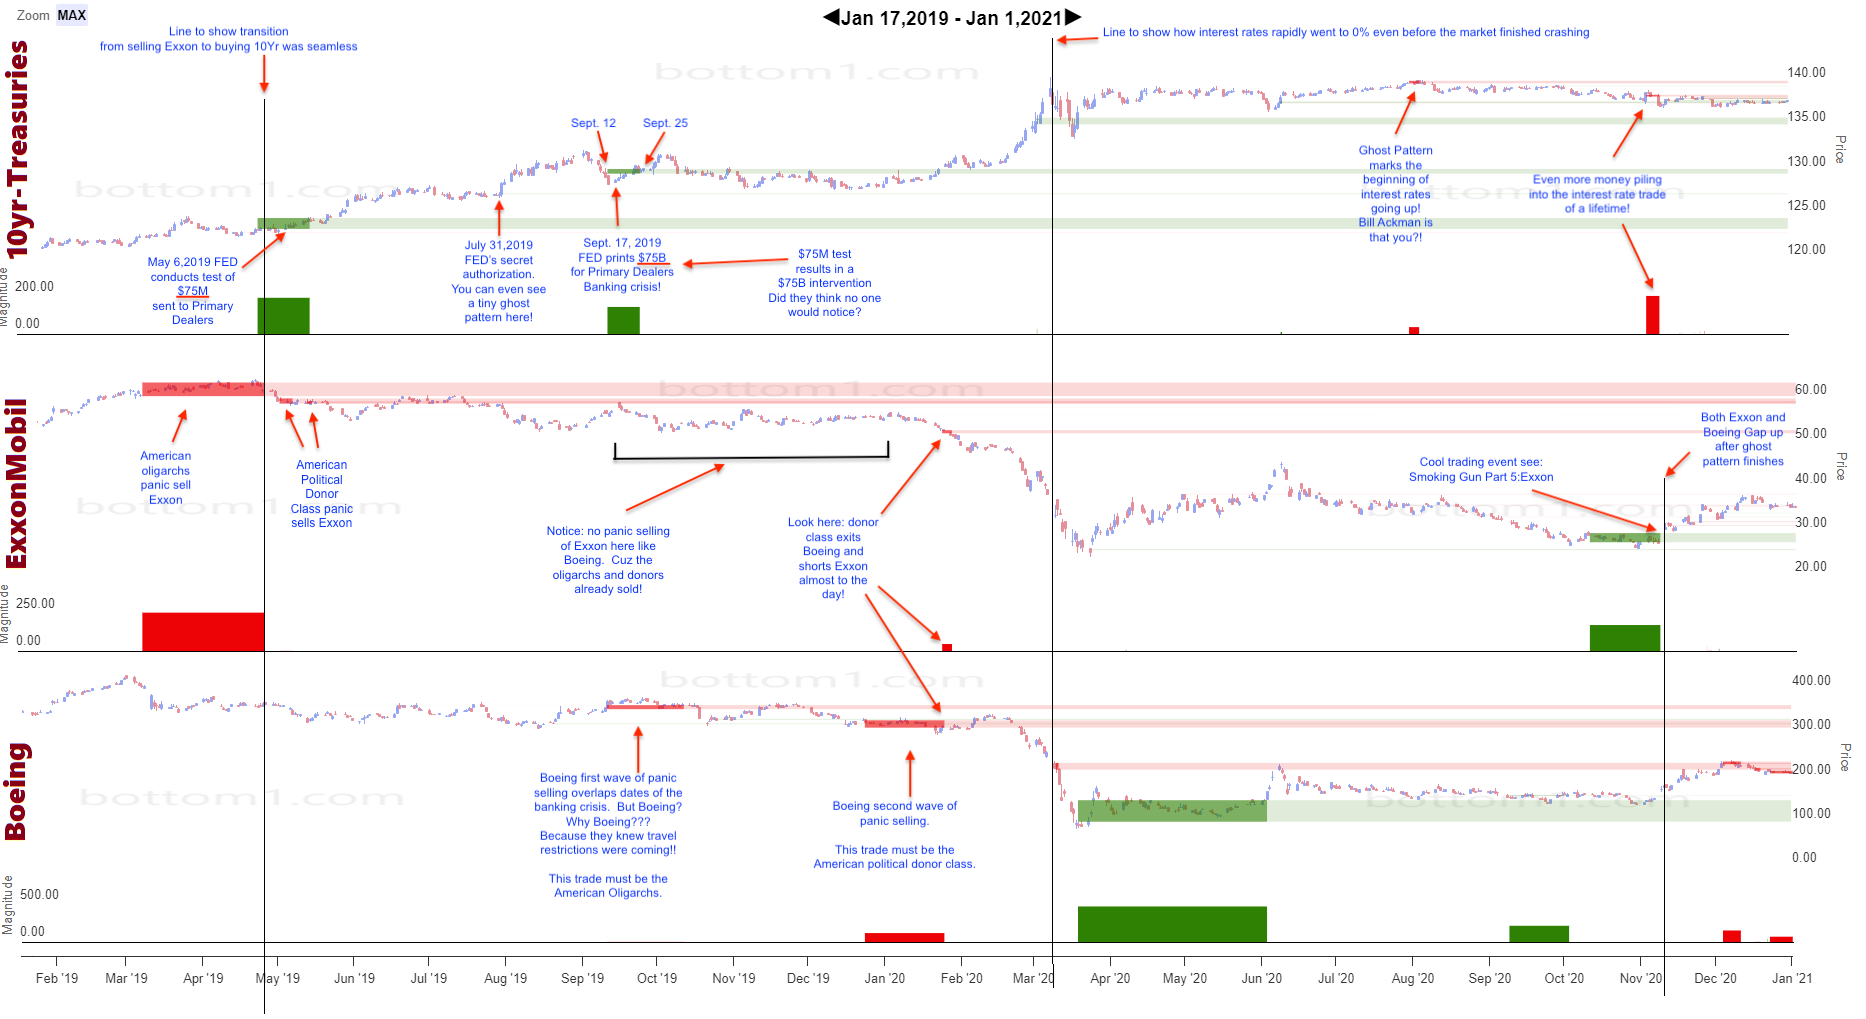
Below is an image of 3 charts 10-yr Treasuries, ExxonMobil and Boeing
These charts are stacked on top of each other to help visualize this complex stream of events. The dark red and green rectangles show when the 👻 ghost pattern starts and stops. The lighter red and green colored bands extend the ghost pattern rectangles to the right to help visualize how powerful the price movements are.
Conclusion
There's just-no-way the selling at the very top and the buying at the very bottom are mere coincidence! No one is that great of a trader. Unless, of course, they know what's coming. 👻😎✌️