
How-To
Under this tag I'll be publishing explanations on how to read the ghost pattern. Maybe I'll do a video or two 😉.
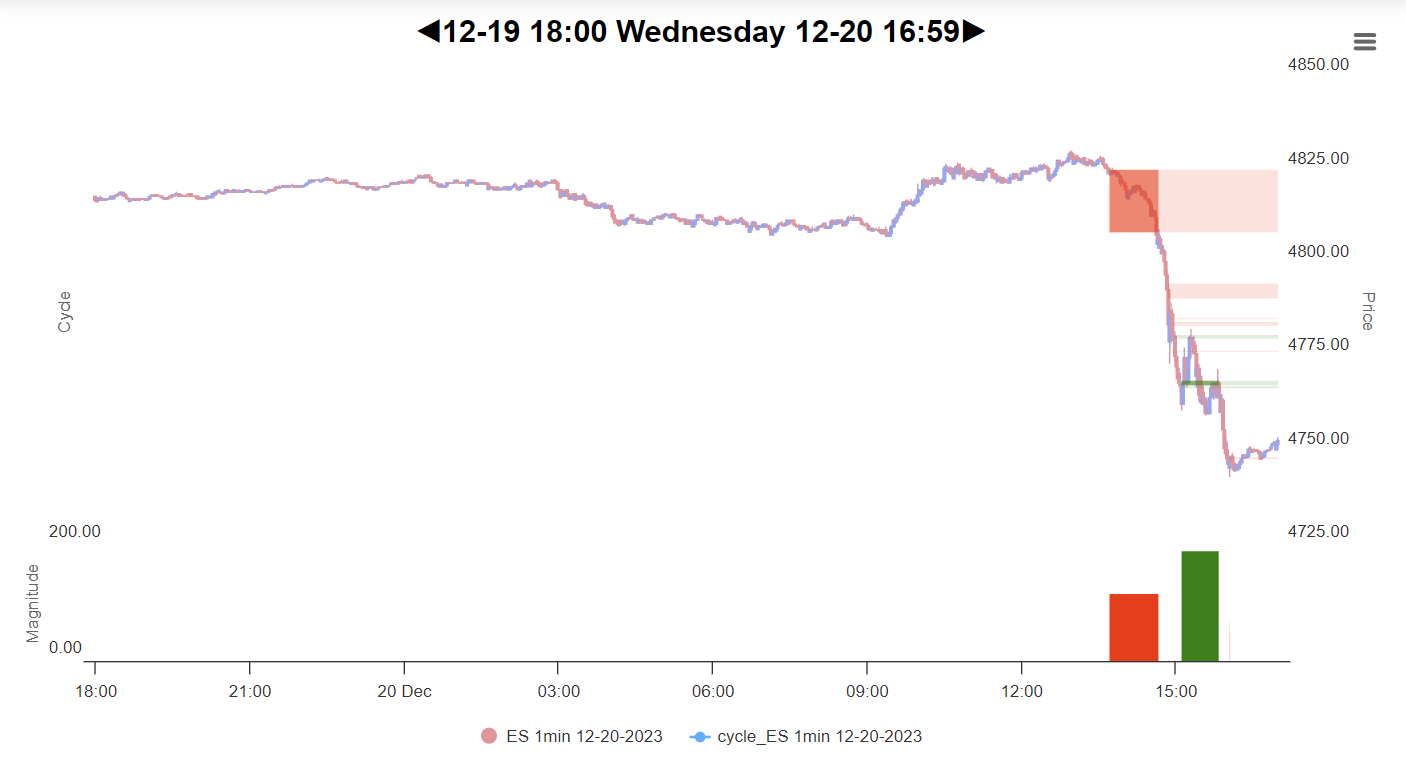
Here's a teaser as to what the 👻 ghost pattern can do. Below is a chart of the S&P 500 Futures contract; 1minute view. Each candle stick represents 1 minute in time. This basically represents the entire S&P 500 index in a futures contract which big money uses to hedge. Anywayy, notice below how the big money gets out all at once (red), and it takes them about 30 minutes of non-stop selling to do so btw. Then after the speculators give up ( they're the smaller red bands after the big red box) there's an attempt to buy (green), and the magnitude of the green is even bigger than the red. That right there was a huge failure of the buyers! Sshhhh don't tell anyone about the "betting"... but right there is a very profitable super low risk short trade. If you're trading futures. 🍑
We'll get into a whole lot more later...