
Smoking Gun Part 5: Exxon
Ghost pattern identifies giant bullish trading event that starts a panic buying frenzy of ExxonMobil stock and call options resulting in +346% increase in stock price. Additionally, 2 separate ghost patterns in ExxonMobil overlap similar ghost patterns in Raytheon stock that erupt call option and stock panic buying for the same 2 world events.
There's so much going on with Exxon Mobil let's just get right into it.
👻Ghost Pattern on Exxon Mobil Stock:
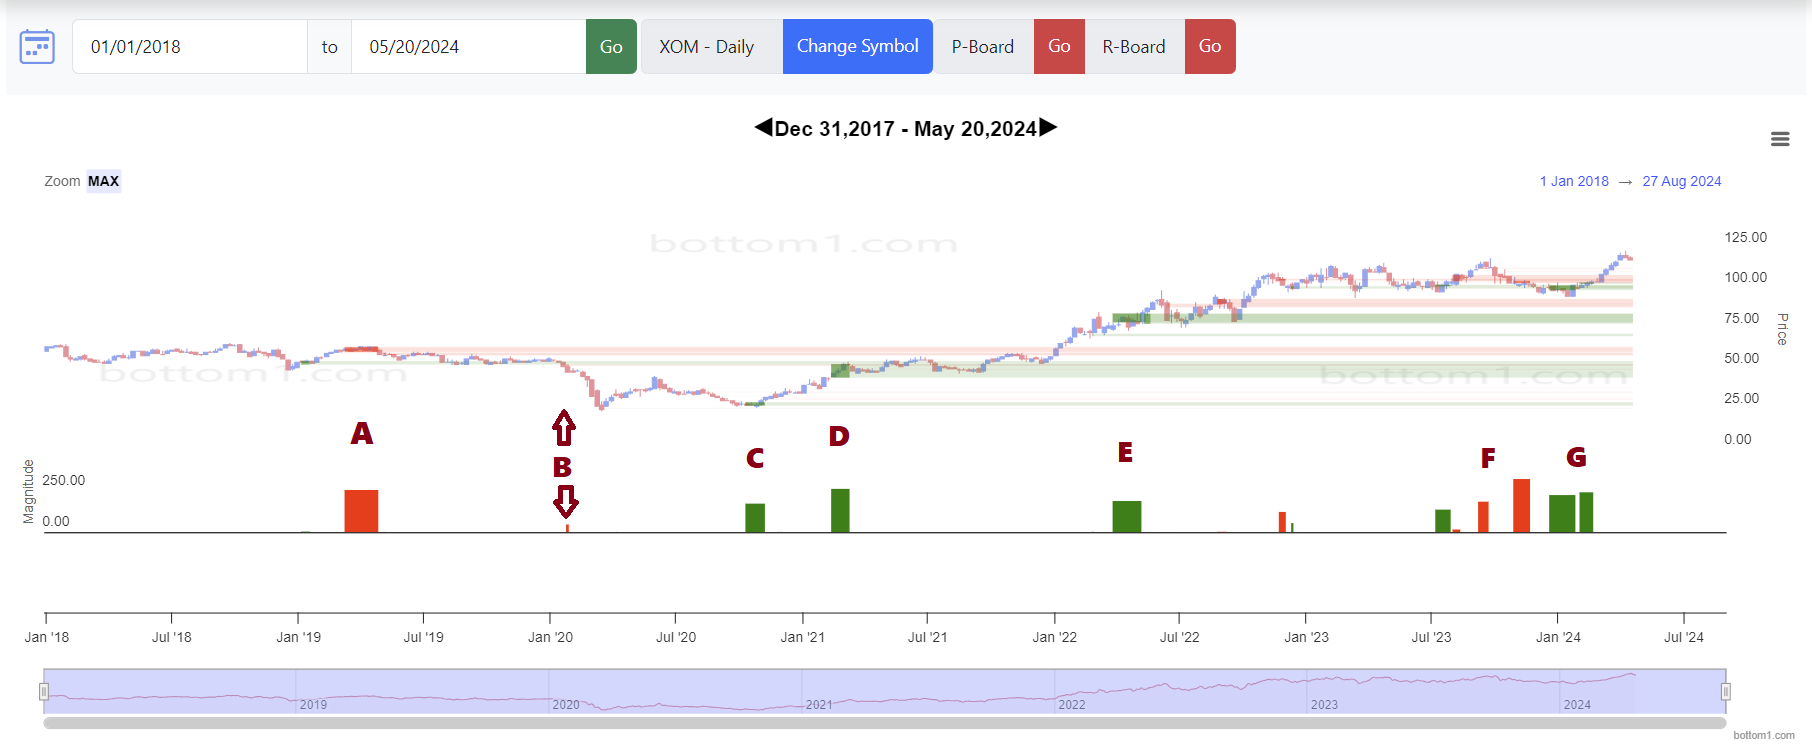
Each red and green band on the image below is my ghost pattern identifying extreme selling and buying.
A & B: Exxon has the worst quarterly results ever then Covid-19 hits?
First, Event A. 👻 Ghost pattern identifies 36 days of non-stop panic selling March 8 - April 26 2019. The reason? The usual... insiders cheaters knew the quarterly results in advance (the funny thing is the ghost pattern ended on the day CNBC published their article about the quarterly results):
 Tom DiChristopher
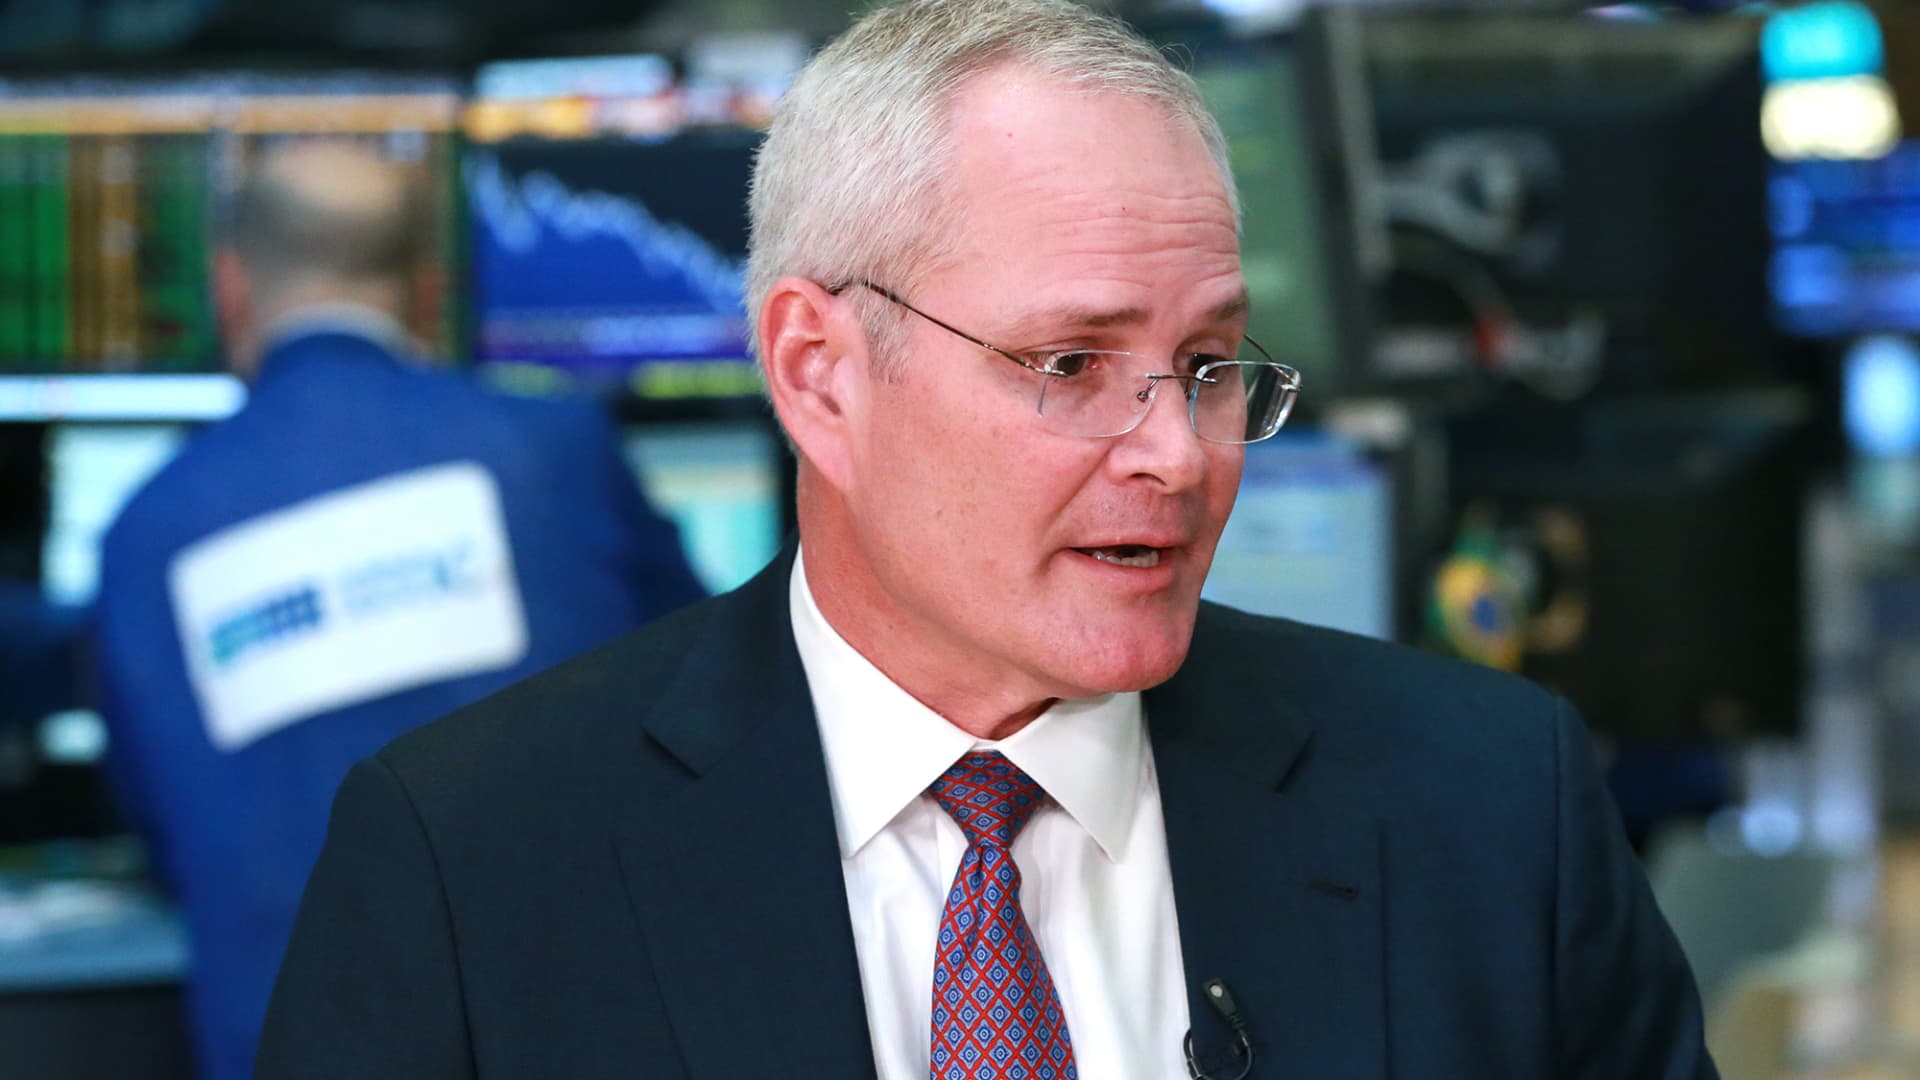
But look at the magnitude of the selling during Event A. For ExxonMobil, it's pretty freaking huge for just having bad quarterly results. Just saying....
Then Event B, 👻 Ghost pattern identifies 3 days of selling January 23 - January 27 2020. A measly 3 days of selling right before the market crashes due to Covid-19. Huh? This event barely even registered on the magnitude area of the chart?! So, what I'm seeing is almost no one was panic selling the largest oil company in America when the insiders cheaters knew damn well lock downs were coming but instead panic sold Boeing (twice)? Weird! But could the selling all the way back to the end of April 2019 (5 months before 💩 started happening) have anything to do with Covid-19 🤷♂️. All I know is there's some seriously crazy stuff happening before Covid-19 hit our shores. Here's a quick summary: a secret banking crisis occurs in September 2019 and the Federal Reserve starts bailing out the giant Wall St. banks to the tune of Trillions. I'll get to this in a later post. Then, our intelligence community starts to warn the Whitehouse as early as November 2019 about a flu like pandemic sweeping China. All politicians start dumping their stocks in January 2020 (how nice). Some even shorted the S&P500 futures market (again a later post which will hurt...a lot) etc. etc. etc. Make up your own minds about Event A and why it was such a panic selling event... Was it simply just a super bad quarterly report? All I can say is when a ghost pattern of that magnitude fires, better get ur mind right. ✌️
C: An absolute 💎gem of a technical trading event.
I didn't bother looking for what news could have precipitated this event because the technical trading aspect of it is so amazing. Proving how powerful my 👻 ghost pattern is when you combine it with technical trading. See the chart below:
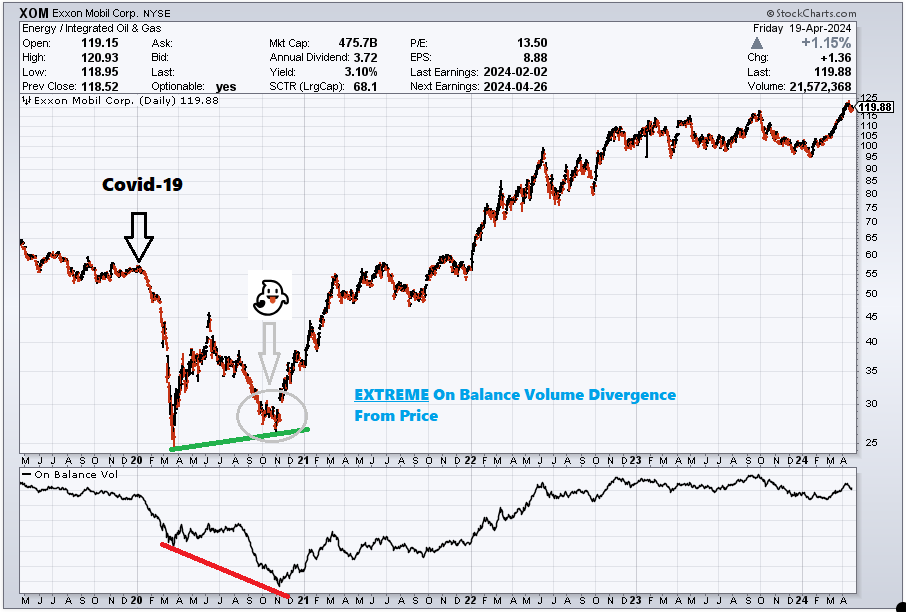
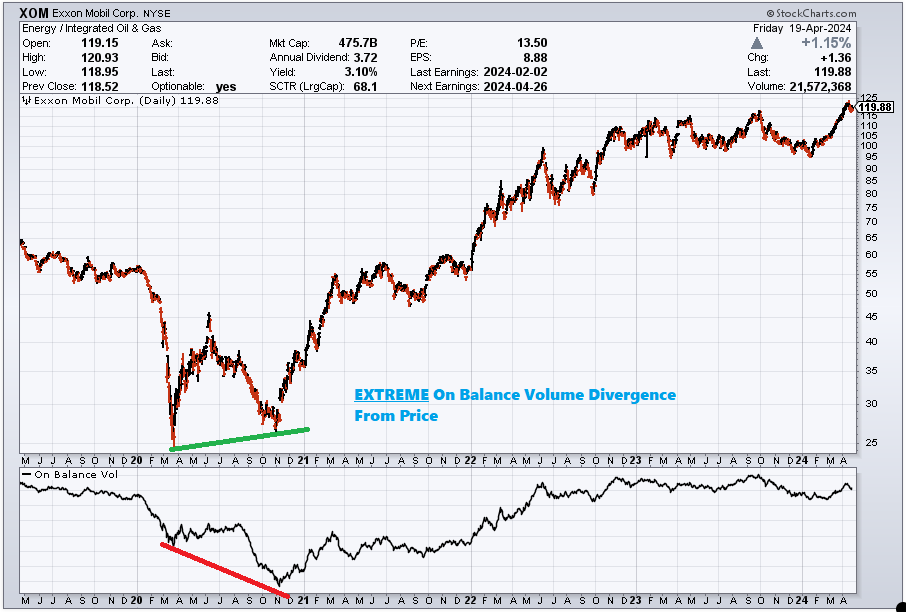
I pulled this chart from Stockcharts.com. It's a daily chart that's compressed to showcase this event's size. The indicator under the price chart is called the On Balance Volume (OBV). It's actually a very cool indicator that most traders don't really use anymore, but when used correctly it can be powerful. The lines I've drawn, clearly show the OBV keeps pushing lower, like waaaayy lower while the stock price doesn't push lower. This is a very bullish indicator. In terms of how OBV works, this is called "divergence" and this is what you look for in this indicator. But patience with OBV is very important because if you look closely, the OBV divergence event was going on for 4 months (Aug, Sep, Oct, Nov 2020). Then my 👻 ghost pattern fires right at the end from Oct 9 - Nov 6 2020 which is 21 trading days of non-stop panic buying. Literally marking the bottom! If you look closely you can see that right when the ghost pattern stops, XOM stock gaps up! Look what happens next. An absolute buying frenzy. Winning Lottery Ticket level profits occur at these moments my friends 💰. That right there is how you do it! Pro tip: if you think you can start using the OBV indicator exclusively and expect to make a lot of money, I can promise you this: you will lose all your money. Indicators like this only work when confluence occurs across many indicators. But trust me, everyone has thought of this already so it's not very reliable and fails more often than it works. However, if you have an amazing indicator, which no one else has (👻) that can predict big market moving events with ferocious accuracy and you see confluence with OBV... well you get the picture.
D: Russia begins to move troops to the Ukrainian border.
Ghost pattern detects 20 days of non-stop panic buying Feb 10 - March 9, 2021. I already covered this in my post about Raytheon here. However, I should note that if a ghost pattern fires in a related stock at the same time....something is definitely up in the world! Since I discovered my ghost pattern on November 14th 2023, finding overlapping ghost patterns on related stocks is a brand new technical trading indicator that only happens here at bottom1.com. 😎
E: The Actual Invasion of Ukraine
Ghost pattern detects 40 days of FOMO buying between March 25 and May 19, 2022. FOMO is short for Fear Of Missing Out. Let me explain what's going on here. The insiders cheaters who got in during Event D took profit and then started buying more as the price bounced off Event D for the next 5 months. This profit taking and re-buying their position caused violent up and down moves in the stock. If you look closely, you'll see that the "FOMO buyers" didn't really see good profits for 5 months. October is when the stock took off again..
F: Just before Hamas attacks Israel, Exxon is dumped?
Yea I don't get this one but it is what it is. Let's try and make some sense of it. September 6 - September 21, 2023 (12 days of selling) just 2 weeks before Hamas attacks Israel on Oct 7 2023. If you look closely at the dates, Event F does cause the price to drop then Oct 7th causes it to jump just a little, then finally another, even bigger ghost pattern triggers Oct 27 - Nov 20 2023 (17 days of heavier selling). This causes the price to fall further. So Exxon stock is a net loser during the Hamas attack. I guess the insiders cheaters realized this would be just a skirmish and wouldn't effect world oil markets. But then the Israelis take it too far and start killing 10's of thousands of civilians in Gaza which erupts another battle in Yemen, greatly affecting shipping through the Red Sea and apparently backed by Iran...
G: Panic buying just before the Israelis launch a missile strike against Iranian embassy in Syria
During war, things happen quickly and the insiders cheaters move their money just as quickly regardless of what happened before because they don't care what just happened, they trade what's about to happen. Ghost pattern buying event starts and occurs in 2 waves lasting between December 18 2023 - February 20 2024. You can see the 2 green bars at event G on the chart. This event overlaps the Raytheon panic buying for the same event. Overlapping ghost patterns again! 😎
Conclusion
The conclusion is I'm warn out writing this article. You get the picture but if you don't, follow me on X: Better get ur mind right. This one's gonna rewrite the street code.👇